
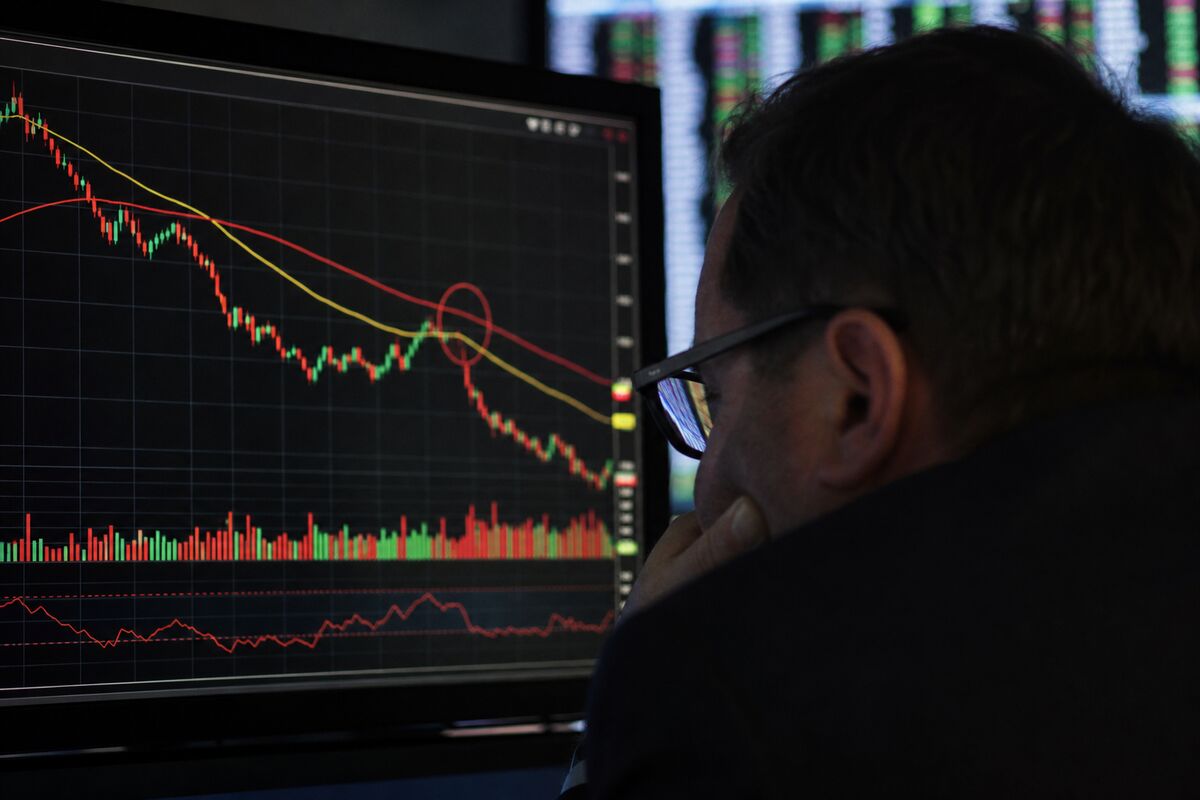
MACD vs moving average crossover comes down to speed versus survival. On 2017–2026 Nasdaq.com data, a MACD(12,26,9) signal-line system flagged major tops within two to three sessions, but it traded 10 to 11 times a year and 58–61% of its trades were whipsaws. The 50/200-day crossover traded five times, stayed invested about 82% of the time and beat MACD on both $SPY and $QQQ. Neither beat buy-and-hold.
That is the short version. The long version is a scorecard built from 2,513 daily closes per ETF, and it explains why traders on Traders On Trend keep arguing about this pairing. One signal is early and noisy. The other is late and quiet. The data puts a price on both habits.
How the two signals are built
MACD was developed by Gerald Appel in the late 1970s, according to StockCharts ChartSchool. The MACD line is the 12-day EMA minus the 26-day EMA. The signal line is a 9-day EMA of the MACD line. The histogram is the gap between the two. A bullish cross happens when the MACD line moves above the signal line, and a bearish cross is the reverse.
A moving-average crossover is blunter. When a shorter simple average crosses above a longer one, that is a bullish cross. The 50/200-day version is the famous golden cross and death cross, covered in depth in the golden cross vs death cross breakdown. ChartSchool's moving average guide puts the trade-off plainly: crossovers "produce relatively late signals," and without a strong trend they "produce many whipsaws."
Both tools are built from moving averages. The difference is the time frame. MACD compares averages that span roughly two and a half and five weeks of sessions. The 50/200 compares averages that span about ten weeks and about forty weeks.
The backtest setup
- Data: Nasdaq.com historical data, daily closes for $SPY and $QQQ, November 4, 2016 to November 4, 2026.
- Test window: August 22, 2017 to November 4, 2026. That is the first session with a full 200-day average, and every system and the buy-and-hold benchmark use the same window.
- Rules: Long-only. Go long at the close of the day the fast line finishes above the slow line, and go to cash at the close of the day it finishes below. At the start date, each system takes whatever position its signal already shows. Cash earns nothing.
- Systems: MACD(12,26,9) signal-line crosses, a 50/200-day SMA crossover, and a 20/50-day SMA crossover as a middle-speed reference.
- Whipsaw: A closed trade that lasted under 10 sessions or lost money.
Prices are not dividend-adjusted, so every return here is price-only. The test also ignores costs, taxes and slippage, assumes fills at the exact close, uses two ETFs that survived the whole decade, and covers a single nine-year window.
The scorecard: $SPY and $QQQ, 2017–2026
| System | Trades | Win rate | Whipsaws | Time in market | Total return | CAGR | Max drawdown |
|---|---|---|---|---|---|---|---|
| $SPY buy-and-hold | n/a | n/a | n/a | 100% | +212.4% | 13.2% | −34.1% |
| $SPY MACD(12,26,9) | 104 | 48.1% | 60 (57.7%) | 51.9% | +89.0% | 7.2% | −15.5% |
| $SPY 50/200 SMA | 5 | 3 of 4 | 1 of 4 | 81.7% | +109.4% | 8.4% | −34.1% |
| $SPY 20/50 SMA | 20 | 57.9% | 8 (42.1%) | 72.4% | +93.5% | 7.4% | −29.6% |
| $QQQ buy-and-hold | n/a | n/a | n/a | 100% | +383.2% | 18.7% | −35.6% |
| $QQQ MACD(12,26,9) | 92 | 50.0% | 56 (60.9%) | 52.2% | +129.6% | 9.5% | −24.9% |
| $QQQ 50/200 SMA | 5 | 4 of 4 | 0 of 4 | 82.5% | +334.2% | 17.3% | −28.6% |
| $QQQ 20/50 SMA | 21 | 61.9% | 8 (38.1%) | 70.6% | +174.2% | 11.6% | −26.9% |
Win rates and whipsaws count closed trades only. Each 50/200 system still holds an open trade from mid-2025, so four trades on each ETF have closed. Max drawdown is measured on each system's own equity curve over the window.
The numbers show three things.
- MACD cut drawdowns roughly in half on $SPY, from −34.1% to −15.5%. It paid for that by sitting in cash 48% of the time and giving up more than half of the buy-and-hold gain.
- The 50/200 kept the most return. On $QQQ it captured +334.2% against +383.2% for holding. But on $SPY its worst drawdown matched buy-and-hold at −34.1%, because the 2020 crash bottomed before the death cross fired.
- Win rate misleads. MACD won about half its trades, and it still made money because average wins were about twice average losses: +2.91% versus −1.42% on $SPY and +4.25% versus −2.22% on $QQQ.
Whipsaws: the price of speed
MACD fired about 11 trades a year on $SPY and 10 a year on $QQQ. The 50/200 averaged about one every two years. Of MACD's 104 closed $SPY trades, 51 lasted under 10 sessions. On $QQQ, 43 of 92 were.
The 2022 bear market shows the problem clearly. From the $SPY peak on January 3, 2022 to the October 12 trough, MACD flashed six fresh buy signals into a falling market. On $QQQ, from the November 19, 2021 peak to the December 28, 2022 low, it flashed nine. Each one was a re-entry that the next bearish cross reversed. Across that whole stretch, the 50/200 gave zero false buys.
That is the core trade-off. A fast signal cannot tell a pullback from a bear market, so it treats both the same way.
Lag: how late each signal arrives at real turns
To measure lag, the test took the three biggest closing-basis declines of the 2020s for each ETF. For each one, it counted the sessions from the closing peak to the first bearish cross, and from the closing low to the first bullish cross.
| Decline | MACD exit | MACD re-entry | 50/200 exit | 50/200 re-entry |
|---|---|---|---|---|
| $SPY 2020 (−34.1%) | +2 sessions, −1.4% from peak | +3 sessions, +17.2% off low | +28 sessions, −22.7% | +75 sessions, +41.0% |
| $SPY 2022 (−25.4%) | +3, −2.0% | +1, +2.6% | +48, −12.7% | +77, +16.9% |
| $SPY 2025 (−19.0%) | +2, −2.1% | +5, +8.3% | +38, −12.0% | +57, +24.4% |
| $QQQ 2020 (−28.6%) | +2, −2.8% | +8, +13.3% | +49, −7.6% | +47, +35.2% |
| $QQQ 2021–22 (−35.6%) | +2, −1.6% | +7, +4.0% | +68, −15.5% | +50, +11.8% |
| $QQQ 2025 (−22.9%) | +2, −3.6% | +4, +10.0% | +38, −15.2% | +52, +29.7% |
In four of the six cases ($SPY 2020, $SPY 2025, $QQQ 2020 and $QQQ 2025), the 50/200 death cross came after the low was already in. Across all six, it bought back 47 to 77 sessions after the lows, well above them. MACD's two-to-three-session exits look brilliant in this table. But the table only shows the first signal after each real peak. MACD issued 104 bearish crosses on $SPY over the window, and only five $SPY peaks in that span led to a 10%-plus decline. The whipsaw count above is the bill for the rest.
Where MACD stands at the November 4, 2026 close
- $SPY closed at $766.81. MACD was −2.26, the signal line −1.11 and the histogram −1.15. The bearish signal-line cross came on October 15, 2026, and the MACD line has been below zero since October 30. The histogram narrowed from −1.94 on November 3. Price sat 0.03% below the 50-day SMA ($767.06) and 5.05% above the 200-day ($729.92). The 50/200 has been bullish since its July 1, 2025 golden cross.
- $QQQ closed at $691.95. MACD was −10.76, the signal line −6.78 and the histogram −3.98. The bearish cross came on October 13, and the MACD line has been below zero since October 19. The histogram narrowed from −4.55 the session before. The 20/50 turned bearish on November 3. Price sat 4.37% below the 50-day ($723.56) and 1.67% above the 200-day ($680.56). The 50/200 has been bullish since June 24, 2025.
That mix is the setup this article measures: the fast signal says risk-off, and the slow one has not moved. On $QQQ, the drop from the October 6 close of $759.66 to the November 2 close of $681.09 measured 10.3%. Historically, that kind of gap has resolved both ways. In 2022 the death cross eventually followed. In the $QQQ declines from October 2025 to March 2026 (−12.2%) and from June to July 2026 (−11.3%), it never fired.
Bull/Bear Verdict
Bull Case: Where it helps: MACD's first sell came within two to three sessions of all six major 2020s peaks measured, and it cut $SPY's worst drawdown from −34.1% to −15.5%. The 50/200 stayed invested about 82% of the time and captured +334.2% of $QQQ's +383.2% with zero whipsaws.
Bear Case: Where it misleads: MACD's speed came with 60 whipsaws on $SPY and nine false buys during the 2022 $QQQ slide, and the 50/200 sold after the low in four of six major declines. No version beat buy-and-hold over 2017–2026.
FAQ
Is MACD better than a moving average crossover?
On this 2017–2026 test, no, not on return. The 50/200 crossover returned +109.4% on $SPY versus +89.0% for MACD, and +334.2% versus +129.6% on $QQQ. MACD did have smaller drawdowns, at −15.5% and −24.9%.
Which moving average crossover was tested?
The main comparison uses the 50-day and 200-day simple moving averages. A 20/50 crossover was added as a mid-speed reference. It landed between the two on trade count, with 20 to 21 trades, and on whipsaw rate, at 38–42%.
How often does MACD give false signals?
Of the closed trades, 57.7% on $SPY and 60.9% on $QQQ either lasted under 10 sessions or lost money. Just under half of all MACD trades on each ETF lasted under 10 sessions: 51 of 104 on $SPY and 43 of 92 on $QQQ.
Can MACD and a moving average crossover be combined?
Traders use the slow crossover as a trend filter and MACD for timing inside it. This test did not backtest that combination, so the numbers above do not support any claim about how it performed. More rule-based studies sit in the Analysis section.